시스템 로그를 수집하여 저장하고 시각화 해보려고 한다.
Fluentd 플루언트디
- 용도
- 다양한 소스에서 로그 데이터를 수집하고 여러 목적지로 전송하기 위한 오픈 소스 데이터 수집 에이전트
- 다양한 소스에서 로그 데이터를 수집하고 여러 목적지로 전송하기 위한 오픈 소스 데이터 수집 에이전트
- 장점
- 다양한 소스에서 로그 수집 가능
- 플러그인 아키텍처 지원하여 다양한 데이터 소스 및 데스티네이션 연동 쉬움
- 가볍고 확장성이 뛰어남
- 커뮤니티 지원 활발
- 단점
- 초기 설정이 필요하며 다소 복잡함
- 튜닝이 필요할 수 있다
InfluxDB 인플럭스 DB

- 용도
- 시계열 데이터를 저장하고 조회하기 위한 오픈 소스 시계열 데이터베이스
- 장점
- 시계열 데이터에 특화되어 있어 데이터 저장 및 조회에 최적화
- 간단한 쿼리 언어를 제공하며, 데이터 유형에 대한 유연성이 높음
- 내장된 HTTP API를 통해 쉬운 데이터 접근을 지원
- 단점
- 특정 데이터베이스와 비교했을 때, 다른 유형의 데이터에 대한 처리가 상대적으로 느릴 수 있음
Grafana 그라파나

- 용도
- 다양한 데이터 소스로부터 데이터를 시각화하기 위한 오픈 소스 대시보드 및 시각화 도구
- 장점
- 다양한 데이터 소스와의 통합 지원 (InfluxDB, Elasticsearch, Prometheus 등)
- 간편한 대시보드 구성 및 시각화 설정
- 커뮤니티 및 플러그인 생태계가 활발함
- 단점
- 일부 복잡한 시각화 요구사항에 대해서는 학습이 필요할 수 있음
InfluxDB설치하기
https://docs.influxdata.com/influxdb/v2/install/?t=Linux
Install InfluxDB | InfluxDB OSS v2 Documentation
Thank you for your feedback! Let us know what we can do better:
docs.influxdata.com
# 다운로드 및 설치
sudo apt install curl
curl -O https://dl.influxdata.com/influxdb/releases/influxdb2_2.7.4-1_amd64.deb
sudo dpkg -i influxdb2_2.7.4-1_amd64.deb

# 서비스 시작
# service file 위치 /lib/systemd/system/influxdb.service
sudo service influxdb start

# 서비스 상태 확인
sudo service influxdb status
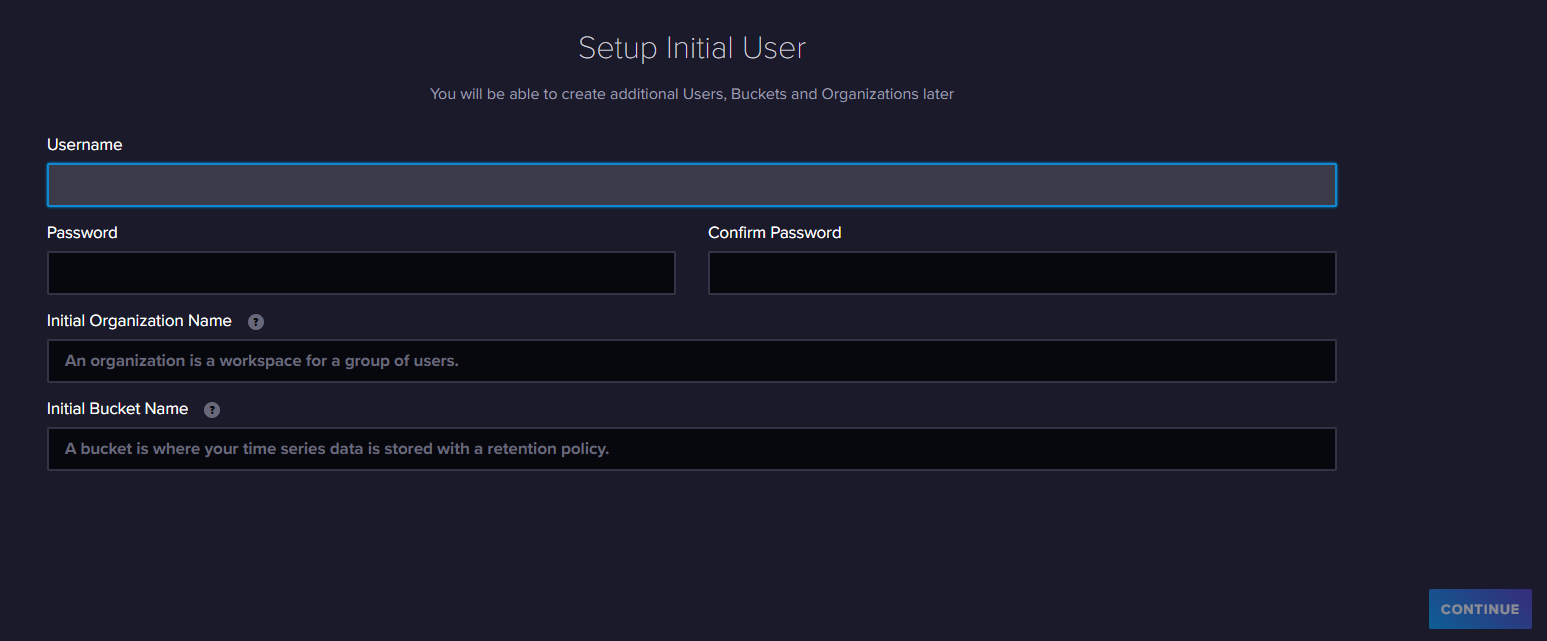
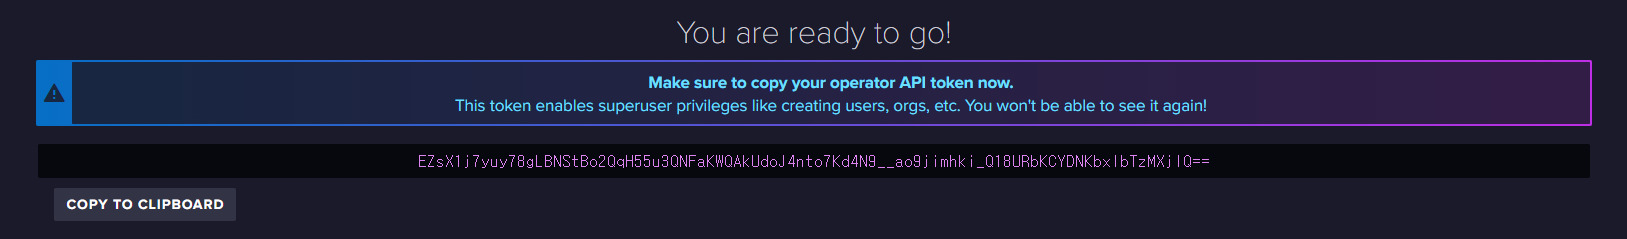
- GUI로 시작하기 http://127.0.0.1:8086 브라우저에서 접속

Fluentd 설치 전 권장사항
참조 : https://docs.fluentd.org/installation/before-install
Before Installation - Fluentd
Fluentd sometimes uses predictable paths for dumping, writing files, and so on. This default settings for the protections are in /etc/sysctl.d/10-link-restrictions.conf, or /usr/lib/sysctl.d/50-default.conf or elsewhere.
docs.fluentd.org
- 설치전 권장사항 - NTP (Network Time Protocol) 설치 및 설정
- NTP는 컴퓨터 네트워크를 통해 시간을 동기화하는 프로토콜입니다. 정확한 시간 동기화는 로그 및 이벤트 기록과 같은 작업에 중요합니다.
# NTP 설치
sudo apt update
sudo apt install -y ntp

# NTP 서비스 확인
sudo systemctl status ntp

# NTP 설정 (필요시 확인)
sudo vi /etc/ntp.conf

# 서비스 재시작 및 활성화
sudo systemctl restart ntp
sudo systemctl enable ntp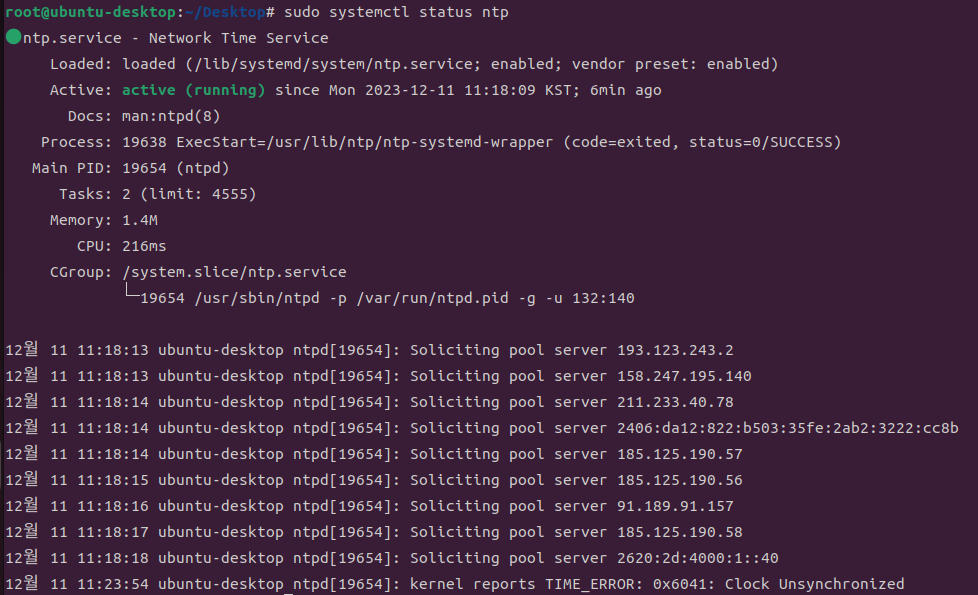
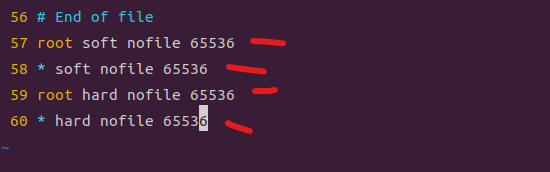
- 설치전 권장사항 - 최대 파일 설명자 수 늘리기
- Fluentd가 대량의 로그를 처리할 때 운영체제의 파일 디스크립터(File Descriptors) 제한을 늘리는 것이 좋습니다. 이를 통해 fluentd가 동시에 여러 파일을 열어 로그를 효율적으로 처리할 수 있습니다.
# Check File Descriptors
ulimit -n

# 설정 변경
sudo vi /etc/security/limits.conf

# limits.conf 끝에 추가, 저장 후 시스템 리부팅
root soft nofile 65536
* soft nofile 65536
root hard nofile 65536
* hard nofile 65536
- 설치전 권장사항 - 네트워크 커널 매개변수 최적화
- Fluentd 인스턴스가 많은 고부하 환경의 경우 필요시 적용
- 최적화는 빠르게 대량의 로그를 처리하고 전송하는 데 도움이 됩니다.
# 네트워크 파라미터 확인
sysctl -a | grep net
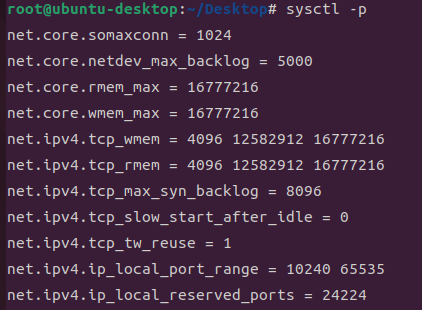
# 네트워크 파라미터 최적화
sudo vi /etc/sysctl.conf
##### sysctl.conf 설정 추가 ####
# 커널이 대기열에서 연결 요청을 받을 수 있는 최대 백로그 크기를 설정합니다. (대기열의 최대 길이)
net.core.somaxconn = 1024
# 네트워크 디바이스에서 수신한 패킷의 최대 대기열 크기를 의미합니다. 최대 5000개의 패킷 대기
net.core.netdev_max_backlog = 5000
# TCP 수신 소켓의 최대 수신 버퍼 크기를 지정합니다. 최대 16MB(16777216 바이트)
net.core.rmem_max = 16777216
# TCP 송신 소켓의 최대 송신 버퍼 크기를 지정합니다. 최대 16MB(16777216 바이트)
net.core.wmem_max = 16777216
# TCP 송신 버퍼의 최소, 기본, 최대 크기를 지정합니다. 최소 4096, 기본 12582912(12MB), 최대 16777216(16MB)
net.ipv4.tcp_wmem = 4096 12582912 16777216
# TCP 수신 버퍼의 최소, 기본, 최대 크기를 지정합니다. 최소 4096, 기본 12582912(12MB), 최대 16777216(16MB)
net.ipv4.tcp_rmem = 4096 12582912 16777216
# SYN 수신 대기열의 최대 길이를 설정합니다.
net.ipv4.tcp_max_syn_backlog = 8096
# TCP slow start 알고리즘을 비활성화합니다.
# 연결이 일정 시간 동안 idle 상태일 때 TCP slow start를 비활성화하는 것으로, 연결이 다시 활성화되면 더 빠르게 전송 속도를 올릴 수 있도록 도와줍니다.
net.ipv4.tcp_slow_start_after_idle = 0
# TIME_WAIT 소켓 재사용을 허용합니다.
net.ipv4.tcp_tw_reuse = 1
# 로컬 TCP 포트 범위를 지정합니다.
net.ipv4.ip_local_port_range = 10240 65535
# 로컬 포트 예약을 설정합니다.
net.ipv4.ip_local_reserved_ports = 24224
################################
# 파라미터 변경사항 적용 및 시스템 재시작
sudo sysctl -p
sudo reboot
- 설치전 권장사항 - 고정 비트 심볼릭 링크/하드링크 보호 사용
sudo vi /usr/lib/sysctl.d/50-default.conf

# 다음 매개변수 1 설정 확인
fs.protected_hardlinks = 1
fs.protected_symlinks = 1
Fluentd 설치하기
https://www.influxdata.com/blog/fluentd-data-collection/
Getting Started with Fluentd for Data Collection
Learn how to use Fluentd to collect and transform data and then store it in a database for analysis.
www.influxdata.com
# Ruby 설치
sudo apt install ruby ruby-dev -y

# 빌드도구 설치
sudo apt install gcc make
	# 또는
sudo apt install build-essential -y


# PATH 설정
export GEM_HOME="$HOME/.local/share/gem/ruby/3.0.0"
export PATH="$PATH:$GEM_HOME/bin"

# 영구적용 - 파일 열고 맨 끝에 위 두줄 추가
vim ~/.bashrc

# Ruby gem 으로 Fluentd 설치
gem install fluentd --no-doc --user-install

# 작동테스트 진행하여 테스트 메시지 확인
fluentd --setup ~/fluent
fluentd -c ~/fluent/fluent.conf -vv &
echo '{"json":"message"}' | fluent-cat debug.test

# 모든 fluentd 종료
killall fluentd
Fluentd - InfluxDB 연동하기
- syslog 메시지 수신하도록 Fluentd 구성하고 InfluxDB로 이동 확인
# InfluxDB 플러그인 설치
fluent-gem install influxdb-plugin-fluent --user-install- Fluentd Configuration
vi ~/fluent/fluent.conf

### fluent.conf ###
<source>
  @type syslog
  port 41514
  source_address_key src_ip
  facility_key facility
  severity_key severity
  <parse>
    message_format auto
  </parse>
  tag influxdb2
</source>


<match influxdb2.*.*>
  @type influxdb2
  url https://127.0.0.1:8086
  ### Organization ID 확인
  org 02ac16f9c17e44f5
  ### 처음에 생성된 API token, 또는 [Load Data] - [API TOKENS] 메뉴에서 GENERATE API TOEKN 으로 생성
  token GyP4aWN6Oj02KZTwxnjHlOhrT5jj3lUkMCiSfvGEO-iHraHbxgehUYxgWhElEOS9z50fm6N72LKOSVjjHIWxRw==
  ### bucket 이름 확인
  bucket test1
  flush_interval 10s
</match>
###################

- Syslog 구성하여 Fluentd로 보내기
sudo vi /etc/rsyslog.conf

# rsyslog.conf 맨 아래 추가

# forward everything to fluentd
*.* @127.0.0.1:41514

# rsyslog 데몬 시작
sudo systemctl restart rsyslog- fluentd 시작
fluentd -c ~/fluent/fluent.conf -vv
- 데이터 확인

Grafana 설치
- 그라파나 설치
https://grafana.com/docs/grafana/latest/setup-grafana/installation/debian/
Install Grafana on Debian or Ubuntu | Grafana documentation
Enterprise Open source Install Grafana on Debian or Ubuntu This topic explains how to install Grafana dependencies, install Grafana on Linux Debian or Ubuntu, and start the Grafana server on your Debian or Ubuntu system. There are multiple ways to install
grafana.com
# 필수 구성 요소 패키지를 설치합니다.
sudo apt-get install -y apt-transport-https software-properties-common wget

# GPG 키를 가져옵니다.
sudo mkdir -p /etc/apt/keyrings/
wget -q -O - https://apt.grafana.com/gpg.key | gpg --dearmor | sudo tee /etc/apt/keyrings/grafana.gpg > /dev/null

# 안정적인 릴리스용 리포지토리를 추가
echo "deb [signed-by=/etc/apt/keyrings/grafana.gpg] https://apt.grafana.com stable main" | sudo tee -a /etc/apt/sources.list.d/grafana.list

# Grafana OSS를 설치
sudo apt-get update
sudo apt-get install grafana


### 제거하기
# systemd 구성
sudo systemctl stop grafana-server
# init.d 구성
sudo service grafana-server stop
# Grafana OSS를 제거
sudo apt-get remove grafana
# Grafana 저장소를 제거
sudo rm -i /etc/apt/sources.list.d/grafana.list
- systemd로 Grafana 서버 시작
# 서비스 시작 및 상태 확인
sudo systemctl daemon-reload
sudo systemctl start grafana-server
sudo systemctl status grafana-server

# 부팅시 서버 시작
sudo systemctl enable grafana-server.service

# 서버 재시작
sudo systemctl restart grafana-server
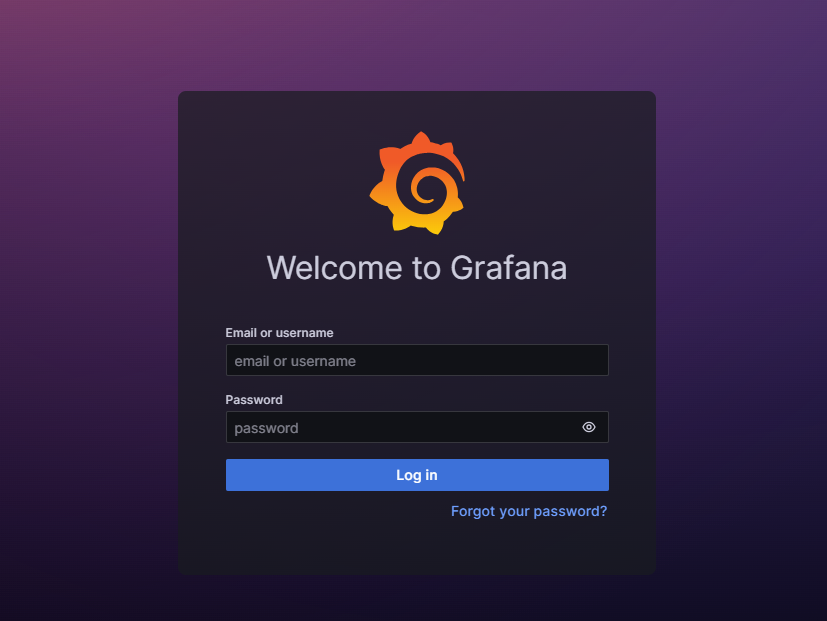
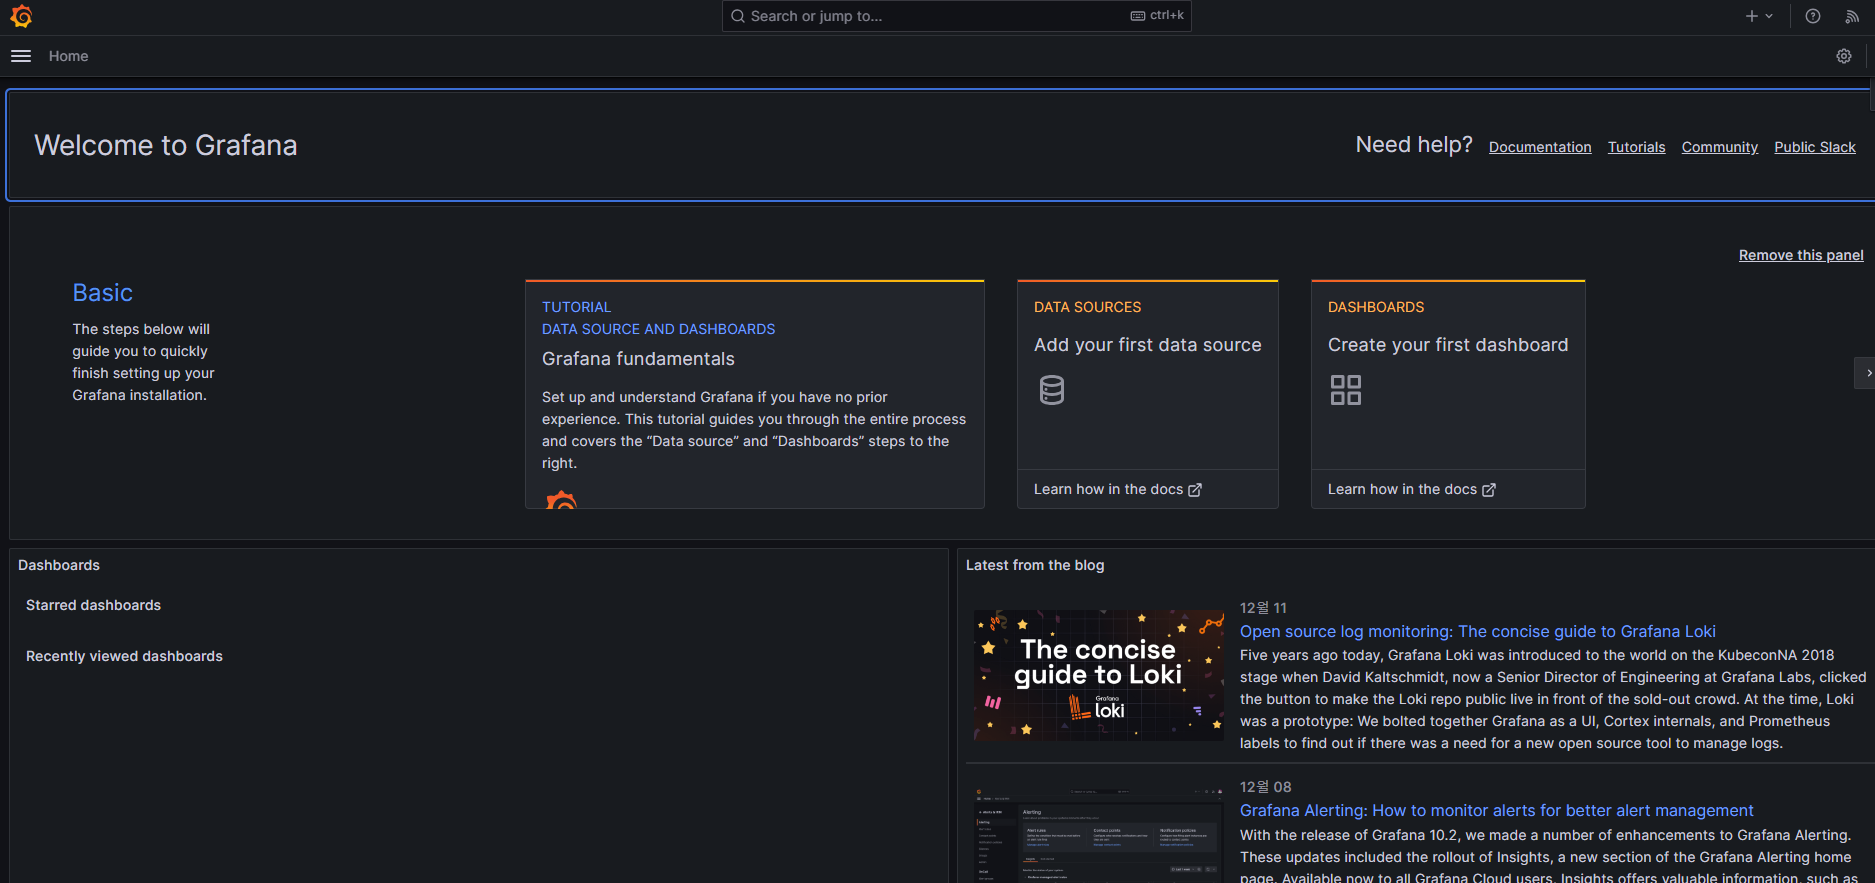
- 브라우저에서 로컬호스트 http://127.0.0.1:3000 접속 (기본계정 ID : admin / PW : admin)
Grafana 및 InfluxDB 시작하기
https://grafana.com/docs/grafana/latest/getting-started/get-started-grafana-influxdb/
Get started with Grafana and InfluxDB | Grafana documentation
Enterprise Open source Get started with Grafana and InfluxDB InfluxDB is an open-source time series database (TSDB) developed by InfluxData. It is optimized for fast, high-availability storage and retrieval of time series data in fields such as operations
grafana.com
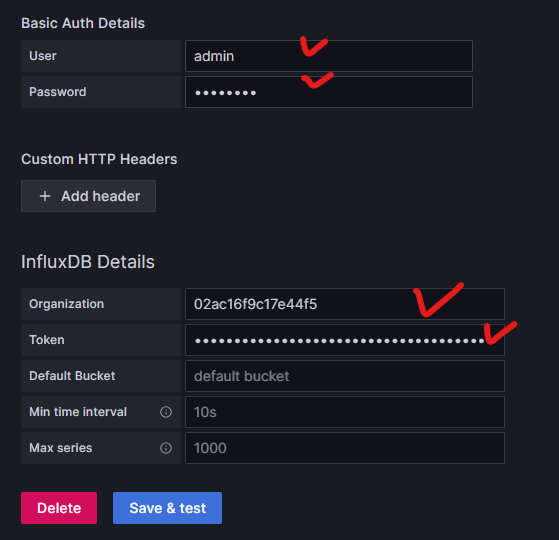
InfluxDB 데이터 소스를 Grafana에 추가
https://grafana.com/docs/grafana/latest/datasources/influxdb/#configure-the-data-source
InfluxDB data source | Grafana documentation
Unify your data with Grafana plugins: Datadog, Splunk, MongoDB, and more In this webinar, learn how to leverage Grafana's plugin ecosystem for access to 80+ data sources, including plugins for Datadog, Splunk, MongoDB, and more.
grafana.com
- 왼쪽 메뉴 connections 클릭

- InfluxDB 선택


- Data source 설정
- Query language 에서 InfluxQL, Flux 중 하나를 고를 수 있다. InfluxQL 기존에 사용하던 언어로 SQL과 비슷하다고 한다. Flux 는 InfluxDB v1.8 이상에서 지원되는 언어로 쿼리 & 스크립팅 언어로 학습이 필요함.


Build a dashboard


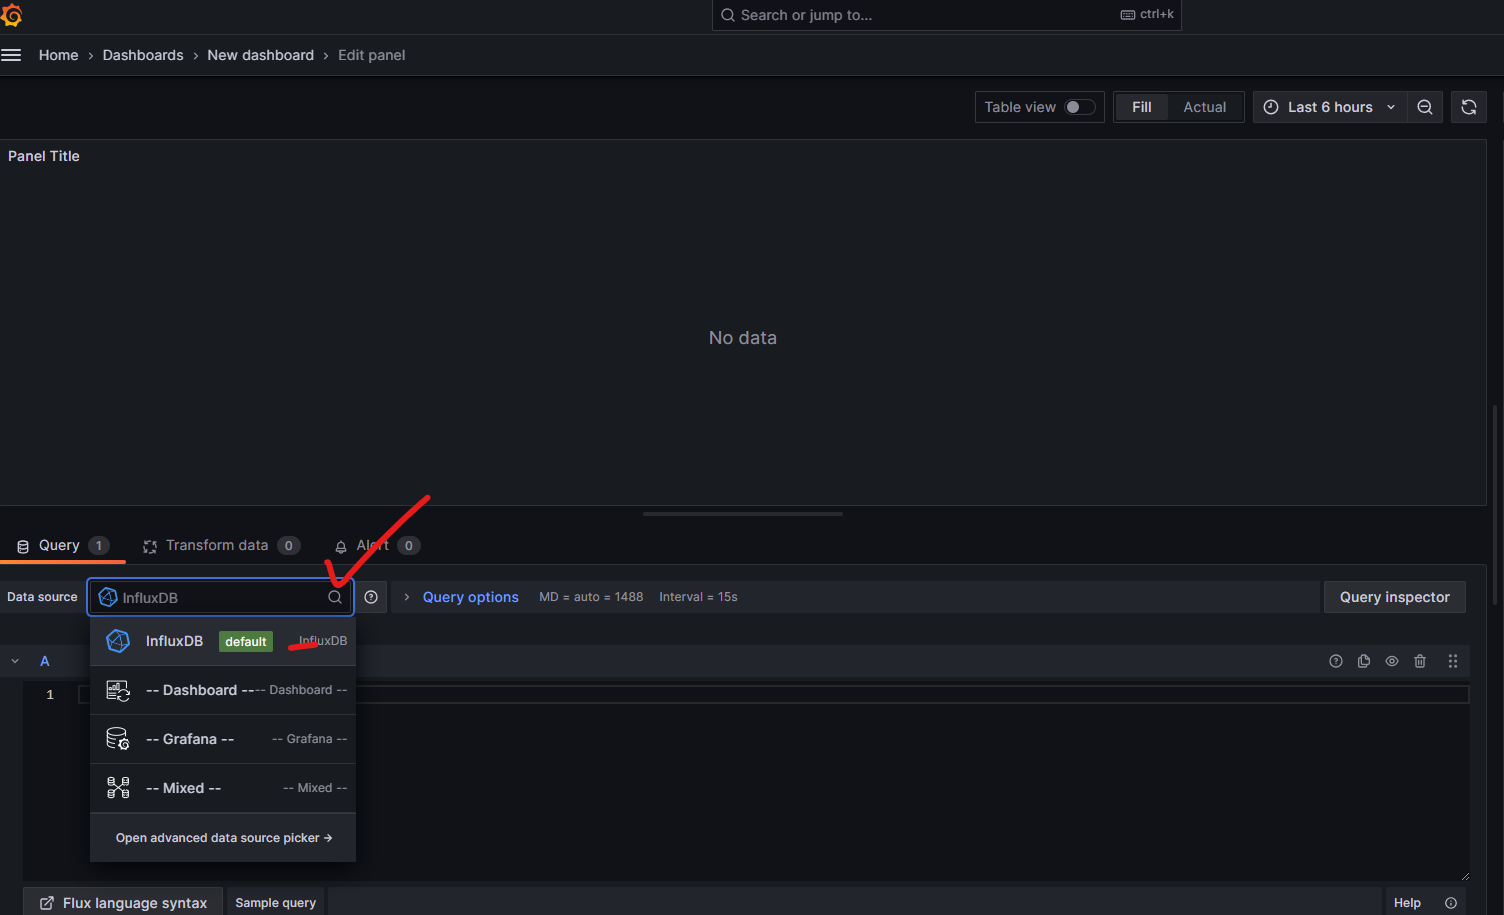
# flux 쿼리 작성

from(bucket: "test1")
  |> range(start: -6h)
  |> group(columns: ["_measurement"])
  |> count()

  # 위의 Flux 쿼리는 InfluxDB에서 test1 버킷의 데이터를 가져와서
  # 6시간 전까지의 시간 범위
  # _measurement 값을 기준으로 그룹화
  # 각 그룹의 데이터 수 반환
Get started with Flux | Flux Documentation
Thank you for your feedback! Let us know what we can do better:
docs.influxdata.com
- Flux 문법은 위 공식문서 및 chatGPT 참조


- 저장을 마치면 대시보드 완성
'Linux' 카테고리의 다른 글
| fluentd-mysql 연동하기 ubuntu22.04 (0) | 2024.01.02 |
|---|---|
| 자빅스 (ZABBIX) 설치 및 PING 모니터링 설정 - ubuntu22.04 (0) | 2023.12.22 |
| SVN 권한 설정 ubuntu 22.04 (apache mod dav svn) (0) | 2023.12.01 |
| SVN 서버 만들기 - Ubuntu 22.04 (4) | 2023.11.21 |
| Git 서버 만들기 Ubuntu 22.04 (0) | 2023.11.14 |


